

NewsNov 16, 2026
Medical Equipment Tariffs: What Three Bills Would Change
Three bills in Congress would cut the president's tariff power and compel duty refunds with interest. What imaging buyers should document now.
By Medtrade EditorRead more →
Four lines decide a refurbished ultrasound purchase: asking price, probe reserve, service cover and downtime. Here is how to price each one honestly.
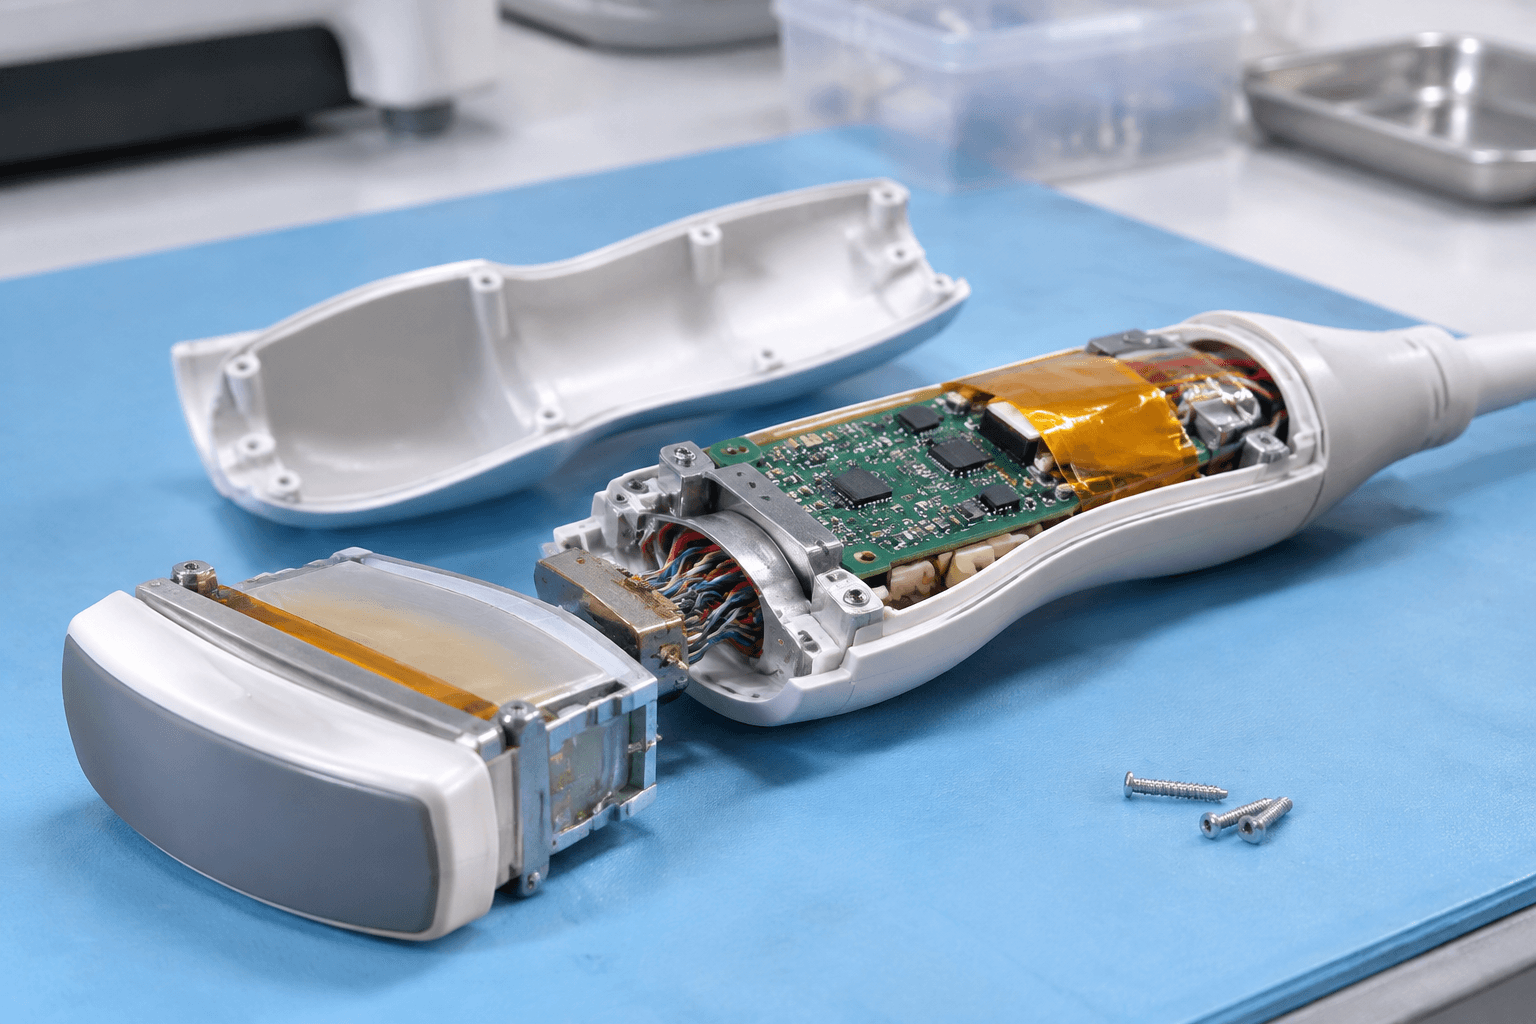
Ultrasound total cost of ownership is not a purchase price divided by years. On our own listings the median complete system asks $5,225 and the median transducer asks $1,65012, and the best-documented failure rate in the literature is about one transducer in seven per year3. Run that over five years and the probe reserve approaches the purchase price itself. The visible number is the smallest part of a refurbished ultrasound budget.
This article prices each line the way a finance committee will ask for it: what the number is, where it comes from, and what a buyer can do about it. Two lines are anchored in data, one arrives only as a quotation, and one is your own scan volume.
Four lines belong in the model, and a fifth belongs in the appendix.
| Line | What goes in it | Where the number comes from | Can a buyer move it? |
|---|---|---|---|
| Capital | System, delivery, installation, training, any probe beyond the sale | Seller quotation; asking prices are an anchor, not a settlement | Yes, by negotiation and scope |
| Probe reserve | Repair or replacement of arrays over the holding period | Published failure rates × probe count × replacement price | Yes, by probe condition and one spare |
| Service | Contract or time-and-materials: parts, labour, software, response | Vendor quotation; no list price is published | Partly, by redesigning coverage |
| Downtime | Scans not performed while the unit is down | Your volume × contribution per scan × days out | Yes, by response terms and a spare |
| Exit | Trade-in value, deinstallation, disposal | Quotation at the end, not the start | Yes, by choosing a supported platform |
The weighting changes when the system is refurbished. An OEM warranty does not travel with a used unit by default, the probe set is usually older than the console, and service is the line a seller can leave out of the headline.
Every figure here is an asking price published by a seller on a live listing, in a snapshot of our own inventory on 16 November 20264. It is not a transaction price.
Of 2,352 live listings in the Ultrasound Transducer category and 980 in Ultrasound General, 664 publish a price at all — 19.9% of the two categories5. The rest are quoted on enquiry, so about one listing in five sets the visible market.
| Percentile | Probes (n = 406) | Complete systems (n = 83) |
|---|---|---|
| P10 | $492 | $2,500 |
| P25 | $945 | $3,650 |
| Median | $1,650 | $5,225 |
| P75 | $2,600 | $9,488 |
| P90 | $3,600 | $19,880 |
Asking prices in USD at the 16 November 2026 snapshot, after the exclusion rules in note 467.
Two readings follow. One replacement array at the median ask equals about a third of the median system ask: $1,650 against $5,225. And 29.6% of priced probes ask under $1,0008, so the bottom of this market is deep.
We publish asking prices because they are what we have. The platform holds 98 buyer inquiries, one recorded quotation and no requests for quotation at this snapshot9, so no completed-sale series sits behind a transaction median. A "market price" for a used ultrasound system is an asking price with another label on it.
Converting an ask into a capital line takes four additions, and none of them is published. Add inbound freight, crating and insurance, import duty and clearance, and de-installation at the seller's end. A buyer who compares two asks without those four is comparing a delivered price with a pick-up price, usually in that order of surprise. Ask for the landed figure in writing before any number enters the model; if a seller will not put it there, the headline is doing work it cannot support.
A probe is a wear item: handled, dropped, coiled, gelled and cleaned every working day. Our notes on cable and connector failures and on common transducer failure modes show what a failing array looks like on a scan.
How often this happens has been measured, repeatedly, in clinical settings.
| Study | Population | Finding |
|---|---|---|
| Hangiandreou et al., 4-year QC programme10 | >265 transducers, >45 scanners | 13.9% average annual transducer failure rate; transducers were 88.2% of all equipment failures |
| Mårtensson et al. 201011 | 299 transducers, tested one year after passing | 27.1% defective (95% CI 22.1–32.1); delamination 13.4%, cable break 9.0% |
| Mårtensson et al. 200812 | 676 transducers, 32 hospitals | 39.8% with a transducer error; delamination 26.5%, cable break 8.4% |
| Vuorenmaa et al. 202513 | 99 transducers, electronic tester | 31% defective |
| Multicentre UK survey 201614 | 219 probes, 12 sites, visual and in-air testing | 37% with at least one fault; 13% to be withdrawn |
Read the spread rather than the friendliest row. The 13.9% is an annual rate in a department running quarterly quality control; the 27.1% is what remained a year after annual testing in high-volume clinics; the 39.8% is a one-time test with no programme in place. All of them find the same two dominant faults: lens delamination and cable break.
Put rate and price together and the line becomes a number. A system sold with four probes, at 13.9% a year, averages 0.56 transducer failures a year15. At the median asking price that is about $917 a year, or $4,585 over five years, if every failure were bought as a used array.
That is our arithmetic on two published inputs, not a published statistic, and it is a ceiling rather than a forecast: most delamination and cable faults are repaired, not replaced.
Two levers move the line without changing the failure rate at all: how many probes arrive with the system, and whether one of them is a spare rather than a slot on the trolley. A spare bought with the system costs nothing extra in freight and removes most of the single-probe exposure; the same probe bought after a failure costs the same money and a week of uptime. For a fleet of four, the reserve is the cheapest insurance in the model.
Compatibility is what stops a buyer shopping the cheapest array. The FDA's UDI database holds 5,235 records whose description contains "ultrasound"16, and openFDA lists 415 premarket notifications under the transducer code ITX against 898 under the system code IYO17. A probe fits a platform, not a brand: budget for the part numbers your console accepts.
The question is not whether the probe is broken but whether the broken part is the expensive part.
| What failed | What it usually is | Usual call | Evidence to demand |
|---|---|---|---|
| Lens delamination | Bond between lens and array | Repair | Element test before and after, lens photo |
| Cable break or connector damage | Conductors at the strain relief | Repair | Continuity plus element map |
| Dead or weak elements | Element or piezo failure | Replace, unless the platform is common enough to re-element | Element count and location map |
| Housing crack or fluid ingress | Mechanical damage | Case by case | Ingress inspection, electrical safety test |
| Image degraded, no fault found | System-side processing | Nothing yet; test on a second console | Side-by-side images on a known phantom |
Two rules follow. A repair quote should arrive with a test report, because the element map is the only evidence the array came back. And a probe that fails while its platform is still supported is worth repairing; the same fault on a platform with no service left is a reason to retire the console.
Ask for one more thing from a repairer: the warranty on the work, in months, and the element map recorded before and after. Without both, a repaired array is an unverified part with a new invoice attached, and the failure simply moves to the next quarter.
Repair is also the cheaper road by default. Delamination and cable faults made up 82.7% of transducer errors in the Stockholm follow-up18, and both are the repairable kind.
Service is the line buyers ask about first and can price last. No ultrasound OEM publishes a list price for service cover on a refurbished system, and we could not find one on any major vendor's public site when we checked on 16 November 202619. Every number arrives as a quotation tied to a unit, a coverage level and a term.
We are therefore not publishing a dollar figure for a service contract. No published price list exists behind one, and an invented figure would be the most expensive sentence here — the one a buyer puts in a committee paper and cannot defend when the quotation lands.
What can be compared is coverage. Two quotes at very different prices are usually two different products.
| Item | Ask for | Why it changes the price |
|---|---|---|
| Hours | 8×5 or 24×7, and what "response" means | Out-of-hours cover is the expensive half |
| Parts | Which assemblies are included and excluded | Probe exclusion is the common gap |
| Probes | Covered per probe, capped, or excluded | The component that fails most is often excluded |
| Preventive maintenance | Visits, and what is tested at each | Test interval matters more than visit count |
| Software | Updates included, platform support status | Support status drives uptime and resale value |
| Response | Hours to on-site, loaner terms, escalation | Feeds the downtime line directly |
| Term and exit | Multi-year discount, exit fee, transfer on resale | A cheap year one can be an expensive year four |
One regulatory point belongs in the service file, and it is not about price. The FDA's guidance on remanufacturing distinguishes servicing — repair or preventive maintenance that returns a device to the OEM's specifications and original intended use — from remanufacturing, which significantly changes performance, safety specifications or intended use and carries the obligations of a manufacturer20. It was issued as final guidance in May 202421.
In practice, a third-party service fitting OEM-equivalent parts and restoring specified performance sits on the servicing side. One that substitutes a different array, rewrites control behaviour or upgrades capability may not. That distinction moves your regulatory position and your resale value, and it deserves a written answer before signature.
Downtime is the only line that is entirely yours, and it computes in one sentence: scans per day, times contribution per scan, times days out of service.
A clinic running 20 scans a day at $60 of contribution loses $6,000 in a five-day outage. That is more than a replacement array and more than the annual probe reserve above. Substitute your own inputs and the line stops being abstract.
The line scales linearly, which is why it deserves two runs rather than one. Halve the daily scan load and the five-day figure halves; double the days out and it doubles; a loaner that arrives in two days instead of five removes three-fifths of it. None of that needs new data. It needs your own numbers written down before the outage, because nobody negotiates a response time from a dark room.
Transducer failures concentrate that exposure: transducers were 88.2% of equipment failures in the four-year programme22. A single-probe clinic that loses its only array is down until a replacement arrives. A four-probe fleet loses one mode of scanning and keeps working, which is the case for a spare.
Testing interval is the other half. In the Stockholm follow-up 27.1% of transducers were defective one year after passing23, which is why the authors conclude annual testing is not sufficient. A contract with one annual inspection is not a detection programme; quarterly mechanical integrity and uniformity checks plus sonographer reports caught 98.4% of the failures in the four-year programme24.
Asking price taken as purchase price. Asking prices carry room in them; they are observable, not settled.
Zero budget for probes. A five-year model with no probe line assumes four arrays survive five years untouched, which no published series supports.
Service quotes compared on total only. Quotes are comparable when hours, parts, probe cover, response and term match. Below that, the cheaper quote is the smaller product.
Third-party service treated as pure savings. The remanufacturing boundary is a cost line: obligations, resale value and support can all move with scope of work.
Downtime left out because it is not an invoice. It never appears in a quotation and is usually the largest avoidable cost.
The worksheet that closes those gaps takes one sitting.
A worked example, using only the median asking prices above: capital $5,225 plus five years of probe reserve at 0.56 failures a year and $1,650 an array, which is $4,58525. Before service and downtime that is $9,810 over five years, and the probe reserve is 88% of the purchase price.
Before any of it, verify the seller, because a TCO model built on a counterparty who cannot produce records models nothing. For the capital line against a new system, our ROI guide works the same question from the revenue side, the downtime economics note covers what maintenance data changes, and the full distributions sit in our 2026 price benchmark.
No independent body publishes a total-cost series for refurbished ultrasound, so we will not invent a comparison. What the data supports is narrower: the capital line is lower, while the probe reserve and service lines carry more risk because the warranty is shorter and the probe set older. Model both.
There is no published price to budget against. Request quotations on the coverage table above, from more than one provider including the OEM, and compare the rows. Until a quotation is in hand, carry the line as unknown rather than as an invented estimate.
At the 13.9% annual failure rate measured in a large department, a four-probe fleet averages about 0.56 failures a year, so one spare covers expected exposure with margin. That is our arithmetic, not a published recommendation. If you would rather attack the failure rate than fund the reserve, the Stockholm follow-up found a significant difference in error rate between the two observed ways the clinics in its sample handled their transducers, and its authors conclude that annual testing is not sufficient on its own and strongly advise a user routine that minimises handling26.
Every figure here is a count or percentile computed from MedTrade's own listing records on 16 November 2026, a value returned by an openFDA query run the same day, or a figure stated in the abstract or conclusions of a named study. Nothing is vendor-reported, nothing is estimated, and no transaction price is published, because the platform holds no completed-sale series. Service contract pricing is absent for the same reason it is absent from the market: no provider publishes one. The arithmetic combining published inputs is labelled as arithmetic.
MedTrade platform, complete ultrasound systems: median asking price $5,225 from 83 cleaned priced listings in Ultrasound General, fields price_hint_min / price_hint_max, all USD https://medtrade.world/categories/1718/products — source level: primary (first-party platform data); retrieved 2026-11-16. ↩
MedTrade platform, ultrasound transducers: median asking price $1,650 from 406 cleaned priced listings in Ultrasound Transducer, same fields and currency https://medtrade.world/categories/1720/products — source level: primary (first-party platform data); retrieved 2026-11-16. ↩
Hangiandreou NJ et al., Four-Year Experience with a Clinical Ultrasound Quality Control Program, Ultrasound in Medicine & Biology 37(8):1350–1357, 2011: average annual transducer failure rate 13.9% across more than 265 transducers https://doi.org/10.1016/j.ultrasmedbio.2011.05.007 — source level: primary (independent study, peer reviewed); retrieved 2026-11-16. ↩
MedTrade production records, 16 November 2026 snapshot: 3,332 ACTIVE listings across the two ultrasound categories, 664 publishing at least one price bound. Exclusions applied before percentiles: price under $1 (6), consoles filed as probes (72), probes with no transducer term in the title (2), non-ultrasound items filed as probes (2), monitors and modules filed as systems (83), systems with no console signal (5), for-parts units (5) — 175 removed from the priced pool https://medtrade.world/categories/1720/products — source level: primary (first-party platform data); retrieved 2026-11-16. ↩
Same snapshot as note 4 (MedTrade production records, 16 November 2026), split by category instead of pooled: Ultrasound Transducer 488 of 2,352 listings publish a price (20.7%), Ultrasound General 176 of 980 (18.0%), combined 664 of 3,332 (19.9%). Every record carries price_currency = USD https://medtrade.world/categories/1720/products and https://medtrade.world/categories/1718/products — source level: primary (first-party platform data); retrieved 2026-11-16. ↩
Percentiles of the cleaned probe set (n = 406), linear interpolation: P10 $492, P25 $945, median $1,650, P75 $2,600, P90 $3,600, minimum $150, maximum $31,250 https://medtrade.world/categories/1720/products — source level: primary (first-party platform data); retrieved 2026-11-16. ↩
Percentiles of the cleaned complete-system set (n = 83): P10 $2,500, P25 $3,650, median $5,225, P75 $9,488, P90 $19,880, minimum $470, maximum $26,500 https://medtrade.world/categories/1718/products — source level: primary (first-party platform data); retrieved 2026-11-16. ↩
Same cleaned set as note 6 (n = 406 probes, 16 November 2026), banded by asking price: 120 of 406 ask under $1,000 (29.6%); $1,000–$4,999 64.8%, $5,000–$9,999 4.2%, $10,000 and above 1.5% https://medtrade.world/categories/1720/products — source level: primary (first-party platform data); retrieved 2026-11-16. ↩
count(*) on the MedTrade production database tables inquiries, quotes and rfqs at the same 16 November 2026 snapshot as note 4: 98 rows, 1 row and 0 rows respectively. No completed-sale price series exists from which to compute a transaction median. The enquiry tables are not publicly exposed; the platform surface these counts sit behind is https://medtrade.world/ — source level: primary (first-party platform data); retrieved 2026-11-16. ↩
Same document as note 3, results and conclusions: 187 equipment problems over four years across more than 45 scanners; mechanical integrity and uniformity checks plus sonographer reports accounted for 98.4% of detected failures https://www.sciencedirect.com/science/article/abs/pii/S030156291100250X — source level: primary (independent study, peer reviewed); retrieved 2026-11-16. The 88.2% transducer share of those 187 failures (about 165 of 187) is taken from the article's full-text results tables, not from the published abstract, which reports the 187 problems, the annual failure rates and the 98.4% detection share; the share is cited here as full-text data under subscription access and cannot be re-checked from the abstract page alone. ↩
Mårtensson M, Olsson M, Brodin LÅ, Ultrasound transducer function: annual testing is not sufficient, European Journal of Echocardiography 11(9):801–805, 2010: 299 transducers, 81 defective (27.1%, 95% CI 22.1–32.1) https://pubmed.ncbi.nlm.nih.gov/20530601/ — source level: primary (independent study, peer reviewed); retrieved 2026-11-16. The fault split — delamination 13.4%, cable break 9.0%, which is roughly 40 and 27 of the 299 and 67 of the 81 defective — comes from the result tables in the subscription full text; the PubMed abstract reports only the 27.1% total and the finding that these two fault types dominate, so the split cannot be re-checked from the abstract page alone. The abstract itself does report a significant difference in error rate between two observed ways the clinics handled their transducers, and a conclusion that annual testing is not sufficient and that a user routine minimising handling is strongly advisable; that is the basis for the handling statement in the FAQ. ↩
Mårtensson M et al., High incidence of defective ultrasound transducers in use in routine clinical practice, European Journal of Echocardiography 10(3):389–394, 2009 (Epub 22 October 2008): 676 transducers from 7 manufacturers at 32 hospitals, 39.8% with a transducer error, delamination 26.5%, cable break 8.4% https://pubmed.ncbi.nlm.nih.gov/18945726/ — source level: primary (independent study, peer reviewed); retrieved 2026-11-16. ↩
Vuorenmaa A et al., Comparison of Three Quality Assurance Methods for Clinical Ultrasound Devices, Journal of Medical and Biological Engineering 45:147–155, 2025: 99 transducers measured with an electronic tester, 31% defective https://doi.org/10.1007/s40846-025-00932-9 — source level: primary (independent study, peer reviewed); retrieved 2026-11-16. ↩
A multicentre survey of the condition of ultrasound probes, 2016: 219 probes at 12 sites, 63% green, 25% amber, 13% red — more than one in three with at least one fault https://pubmed.ncbi.nlm.nih.gov/27847533/ — source level: primary (independent study, peer reviewed); retrieved 2026-11-16. ↩
Arithmetic on note 3 applied to four probes: 4 × 13.9% = 0.556 failures a year; at the note 6 median that is $917 a year and $4,585 over five years. Our calculation, not a published statistic, and an upper bound because it assumes replacement rather than repair — source level: derived from notes 3 and 6; retrieved 2026-11-16. ↩
openFDA UDI endpoint, search=device_description:ultrasound, limit=1, meta total 5,235; API last_updated 2026-11-02 https://api.fda.gov/device/udi.json?search=device_description:ultrasound&limit=1 — source level: primary (regulatory database); retrieved 2026-11-16. ↩
openFDA 510(k) endpoint, two counts on the same date: product_code:ITX total 415, product_code:IYO total 898 https://api.fda.gov/device/510k.json?search=product_code:ITX&limit=1 and https://api.fda.gov/device/510k.json?search=product_code:IYO&limit=1 — source level: primary (regulatory database); retrieved 2026-11-16. ↩
Same document as note 11, error-type distribution: delamination and cable break together constituted 82.7% of the transducer errors found; the underlying counts and the full-text/abstract split are set out in note 11 https://pubmed.ncbi.nlm.nih.gov/20530601/ — source level: primary (independent study, peer reviewed); retrieved 2026-11-16. ↩
Our own check on 16 November 2026: no major ultrasound OEM publishes a list price for service cover on a refurbished system on its public site, and none was found for probe-level cover. A statement about the absence of published prices, not about the price level; quotations are unit-specific and are not reproduced — source level: primary (our own verification, negative result); retrieved 2026-11-16. ↩
FDA, Remanufacturing of Medical Devices, final guidance: servicing is repair or preventive maintenance returning a finished device to the OEM's safety and performance specifications and its original intended use; an activity that significantly changes intended use, performance or safety specifications is remanufacturing, and remanufacturers carry manufacturers' obligations https://www.fda.gov/regulatory-information/search-fda-guidance-documents/remanufacturing-medical-devices — source level: primary (regulatory filing); retrieved 2026-11-16. ↩
Federal Register, Remanufacturing of Medical Devices; Guidance for Industry, Entities That Perform Servicing or Remanufacturing, and Food and Drug Administration Staff; Availability, 89 FR 40490, docket FDA-2018-N-3741, published 10 May 2024 https://www.federalregister.gov/documents/2024/05/10/2024-10230/remanufacturing-of-medical-devices-guidance-for-industry-entities-that-perform-servicing-or — source level: primary (regulatory filing); retrieved 2026-11-16. ↩
Same document as note 10, conclusions: 88.2% of equipment failures detected over four years involved transducers, 11.8% scanner components; the sourcing of that share from the full-text tables rather than the abstract is set out in note 10 https://www.sciencedirect.com/science/article/abs/pii/S030156291100250X — source level: primary (independent study, peer reviewed); retrieved 2026-11-16. ↩
Same document as note 11, result and conclusion: 81 of 299 transducers (27.1%) defective one year after being classified fully operational; annual testing is not sufficient https://pubmed.ncbi.nlm.nih.gov/20530601/ — source level: primary (independent study, peer reviewed); retrieved 2026-11-16. ↩
Same document as note 10, abstract: quarterly mechanical integrity and uniformity assessment recommended; a scanner with five transducers testable in about 30 minutes https://www.sciencedirect.com/science/article/abs/pii/S030156291100250X — source level: primary (independent study, peer reviewed); retrieved 2026-11-16. ↩
Arithmetic combining notes 1 and 15: $5,225 plus $4,585 over five years = $9,810, of which the probe reserve is 87.8% of the purchase price. Service and downtime excluded, both unpriced here for the reasons given in the body — source level: derived from notes 1, 3 and 6; retrieved 2026-11-16. ↩
Same document as note 11, abstract and conclusion, cited as its own note because it is referenced in two places: Mårtensson M, Olsson M, Brodin LÅ, Ultrasound transducer function: annual testing is not sufficient, European Journal of Echocardiography 11(9):801–805, 2010 https://pubmed.ncbi.nlm.nih.gov/20530601/ — source level: primary (independent study, peer reviewed); retrieved 2026-11-16. The abstract reports a significant difference in error rate between two observed ways the clinics handled their transducers, concludes that annual testing is not sufficient on its own, and strongly advises a user routine that minimises handling; those three statements are what the FAQ answer relies on. No figure is added by this note — the 27.1% total and the full-text fault split sit in notes 11 and 18. ↩
Continue reading
Three bills in Congress would cut the president's tariff power and compel duty refunds with interest. What imaging buyers should document now.

Most used ultrasound listings never publish a price. Of those that do, half of all probes ask under $1,650 and half of all systems ask under $5,225.
Philips has put its handheld ultrasound under a Class I recall covering 13,206 systems — its third Lumify recall event in fifteen months. What a buyer must verify, and how to price the risk.